Please wait...
LPU University Admission 2025 - 100% Scholarship - Apply Now Check Here
UPES University Admission 2025 - 100% Scholarship - Apply Now Check Here
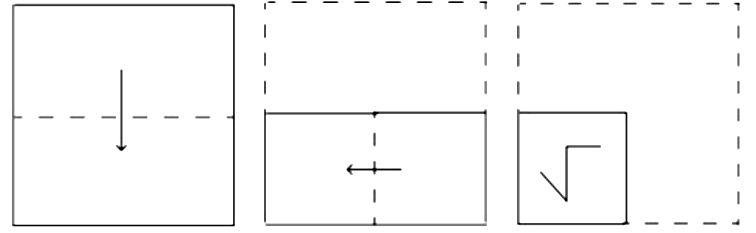
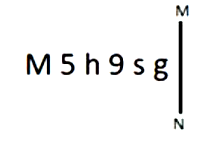
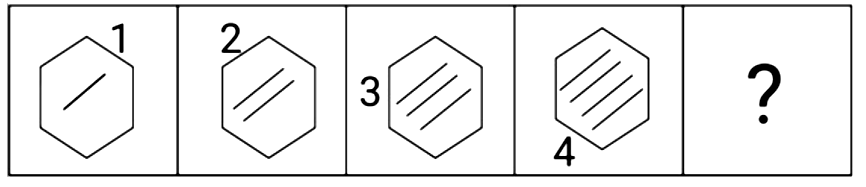
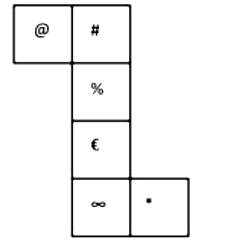
निम्नलिखित चार में से तीन एक निश्चित तरीके से समान हैं और इस प्रकार एक समूह बनाते हैं। वह कौन-सा है जो उस समूह से संबंधित नहीं है?
भिन्न अक्षर-समूह, व्यंजन/स्वरों की संख्या या उनकी स्थिति पर आधारित नहीं है।
Match the concepts in column A with their respective descriptions in column B.
कॉलम A में दी गई अवधारणाओं का कॉलम B में दिए गए उनके संबंधित विवरणों से मिलान कीजिए।
If tan 4θ× tan 6θ = 1, where 6θ is an acute angle, then find the value of cot 5θ.
यदि tan 4θ × tan 6θ = 1, जहाँ 6θ एक न्यून कोण है, तो cot 5θ का मान ज्ञात कीजिए।
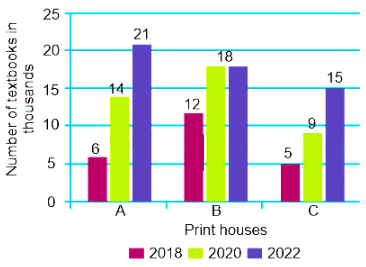
Study the given chart and answer the question that follows.
The following chart shows the production of textbooks in thousands in the years 2018, 2020 and 2022 from the print houses A, B and C, respectively
The ratio of textbooks produced by Print house B in the year 2018 to the textbooks produced by Print house C in the year 2020 is ______.
दिए गए आरेख का अध्ययन कीजिए और उसके बाद दिए गए प्रश्न का उत्तर दीजिए।
निम्नलिखित आरेख क्रमशः प्रिंट हाउस A, B और C से वर्ष 2018, 2020 और 2022 में पाठ्यपुस्तकों के उत्पादन को (हजारों में) दर्शाता है।
वर्ष 2018 में प्रिंट हाउस B द्वारा उत्पादित पाठ्यपुस्तकों का वर्ष 2020 में प्रिंट हाउस C द्वारा उत्पादित पाठ्यपुस्तकों से अनुपात ______ है।
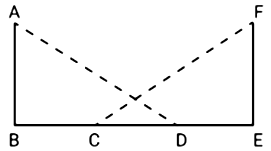
In triangles ABD and FEC, ∠BAD = 60°, l(BD) = l(EC), ∠ABD = ∠FEC = 90°, and l(AB) = l(FE). Find the ratio of ∠BAD∠FCE.
त्रिभुज ABD और FEC में, ∠BAD = 60° हैl(BD) = l(EC), ∠ABD = ∠FEC = 90°, और l(AB) = l(FE) है।∠BAD∠FCE का अनुपात ज्ञात कीजिए।
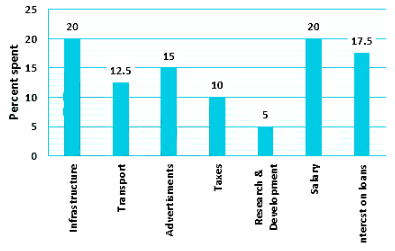
In 2010, a company’s total expenditure was categorised under different expense heads, and their percentage distribution is illustrated in the bar graph given below:
The total amount of expenditure of the company is ______ times that of expenditure on R & D.
2010 में, एक कंपनी के कुल व्यय को विभिन्न व्यय शीर्षों के तहत वर्गीकृत किया गया था, और उनका प्रतिशत वितरण नीचे दिए गए दंड आलेख में दर्शाया गया है:
कंपनी का कुल व्यय, अनुसंधान एवं विकास पर व्यय का ______ गुना है।
The table below shows the production of three types of cars (A, B and C) manufactured (in thousands) by an automobile company over the years.
The average number of A-type cars produced by the company during 2012 to 2014 is what percent (rounded off to the 1 decimal place) less than the combined average number of B-type and C-type cars produced by the company from 2013 to 2015?
नीचे दी गई तालिका में एक ऑटोमोबाइल कंपनी द्वारा वर्षों में निर्मित तीन प्रकार की कारों (A, B और C) का उत्पादन (हजारों में) दिखाया गया है।
2012 से 2014 तक कंपनी द्वारा उत्पादित A-प्रकार की कारों की औसत संख्या, 2013 से 2015 तक कंपनी द्वारा उत्पादित B-प्रकार और C-प्रकार की कारों की संयुक्त औसत संख्या से कितने प्रतिशत (दशमलव के एक स्थान तक पूर्णांकित) कम है?


 ×
×
 Bank
Bank


 SSC
SSC


 Railway


 State
State


 Other
Other


 Teaching


 Insurance


 Medical


 Engineering


 Defence


 GATE
GATE


 NTA CUET

 UPSC
UPSC

 MBA Entrance


 NEET UG 2025
 CUET UG 2025
 RRB NTPC 2024-25
 Railway Group D 2025
 Bihar Police Constable 2025