Please wait...

Column/Bar Graphs Test - 1
Menu grid icon
Result Result point icon
Column/Bar Graphs Test - 1
  • Goals icon

    /

    Score
  • Trophy icon

    -

    Rank
White alarm icon Time Taken: -
Result frame illustration
  • Question 1/5
    3 / -1

    (Q1-Q5) Directions to solve:

    The bar graph given below shows the sales of books (in thousand number) from six branches of a publishing company during two consecutive years 2000 and 2001.
    Sales of Books (in thousand numbers) from Six Branches - B1, B2, B3, B4, B5 and B6 of a publishing Company in 2000 and 2001.


    Q. What is the ratio of the total sales of branch B2 for both years to the total sales of branch B4 for both years?

    Solutions

    Required ratio = 

  • Question 2/5
    3 / -1

    The bar graph given below shows the sales of books (in thousand number) from six branches of a publishing company during two consecutive years 2000 and 2001.
    Sales of Books (in thousand numbers) from Six Branches - B1, B2, B3, B4, B5 and B6 of a publishing Company in 2000 and 2001.

    Q. Total sales of branch B6 for both the years is what percent of the total sales of branch B3 for both the years?

    Solutions

    Required percentage = 

    = 73.17%

  • Question 3/5
    3 / -1

    The bar graph given below shows the sales of books ( in thousand number) from six branches of a publishing company during two consecutive years 2000 and 2001.
    Sales of Books (in thousand numbers) from Six Branches - B1, B2, B3, B4, B5 and B6 of a publishing Company in  2000 and 2001.

    Q. What percent of the average sales of branches B1, B2 and B3 in 2001 is the average sales of branches B1, B3 and B6 in 2000?

    Solutions

    Average sales (in thousand number) of branches B1, B3 and B6 in 2000


    Average sales (in thousand number) of branches B1, B2 and B3 in 2001

    ∴ Required percentage =    = 87.5%

  • Question 4/5
    3 / -1

    The bar graph given below shows the sales of books (in thousand number) from six branches of  a publishing company during two consecutive years 2000 and 2001.
    Sales of Books (in thousand numbers) from Six Branches - B1, B2, B3, B4, B5, and B6 of a publishing Company in 2000 amd 2001.

    Q. What is the average sales of all the branches (in thousand numbers) for the year 2000?

    Solutions

    Average sales of all the six branches (in thousand number) for the year 2000​

    = 80.

  • Question 5/5
    3 / -1

    The bar graph given below shows the sales of books (in thousand number) from six branches of a publishing company during two consecutive years 2000 and 2001.
    Sales of Books (in thousand numbers) from Six Branches - B1, B2, B3, B4, B5 and B6 of a publishing Company in 2000 and 2001.


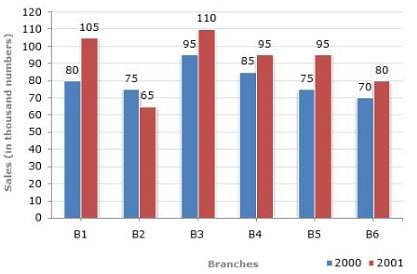
    Q. Total sales of branches B1, B3 and B5 together for both the years (in thousand numbers) is

    Solutions

    Total sales of branches B1, B3 and B5 for both the years (in thousand numbers)
    = (80 + 105) + (95 + 110) + (75 + 95)
    = 560.

Close button icon
User Profile
-

Correct (-)

Wrong (-)

Skipped (-)


  • 1
  • 2
  • 3
  • 4
  • 5
Mockers logo Get latest Exam Updates
& Study Material Alerts!
No, Thanks
Arrow pointer icon
Click on Allow to receive notifications
Notification bell icon ×
Open Now